Webhook Logging Best Practices: What to Log, What to Hide
Webhook logging best practices for receivers: the fields to record, secrets to keep out, retries and duplicates to trace, and alerts that catch failures early.
Reviewed by Maurice Sobiera
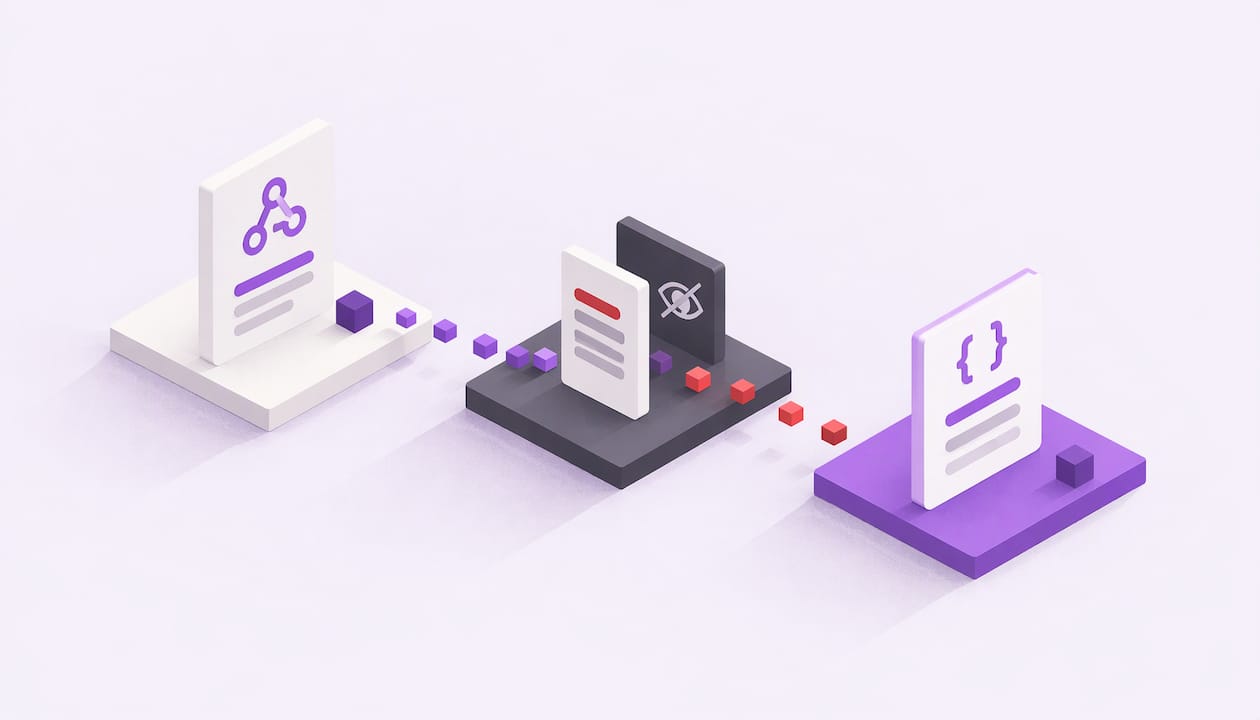
Good webhook logging comes down to one rule: record enough metadata to reconstruct what happened to every delivery, and keep payloads, secrets and signature values out of your logs. Use structured entries keyed by a delivery or event ID. Capture the verification result, the attempt number, the HTTP status you returned and the final processing outcome. Then alert on the patterns that matter: failure spikes, duplicate floods, queue backlog and silence.
This guide shows the fields, the redaction rules, the retry and duplicate patterns, and the alert thresholds. It is written for developers who receive webhooks, including on-chain payment and deposit events.
TL;DR
- Log one structured entry per delivery: event ID, timestamp, endpoint, event type, signature result, attempt number, response status, latency and processing outcome.
- Never log signing secrets, signature header values, Authorization headers or full request bodies. Log a hash and safe identifiers instead.
- Treat duplicates as normal. Key idempotency on the provider’s delivery or event ID and record a “duplicate” state instead of dropping the event silently.
- Verify, enqueue, acknowledge: log each stage separately so you can tell a receiving failure from a processing failure.
- Alert on failure rate, signature failures, queue depth, dead-letter growth and unexpected silence, not on single errors.
Table of Contents
- What a webhook log has to answer
- The fields to log for every delivery
- What to keep out of your logs
- Log signature verification as its own step
- Verify, enqueue, acknowledge: log each stage
- Logging retries, duplicates and failures
- Metrics and alerts built on the logs
- Using the logs to troubleshoot production
- Webhook logging for blockchain events
- Our perspective
- Get decoded, signed events without running nodes
- FAQ
- Sources
What a webhook log has to answer
A useful log answers three questions for any delivery: what arrived, what your system did with it, and how processing ended. If a customer asks why a payment never showed up, you should be able to answer in a minute: did the event reach us, did we accept it, did we process it, and what did we return?

That framing decides the fields. Everything you log should help answer one of those three questions. Anything that does not, such as a full body dump “just in case”, is cost and risk without payoff.
The fields to log for every delivery
Guidance from different sources converges on a short core list. OWASP’s Webhook Security Cheat Sheet recommends logging the timestamp, source IP, HTTP method, response status, event ID, event type and processing latency. Mambu’s documentation adds the endpoint path, the idempotency key header, a high-level result (accepted, rejected or failed) and a correlation or trace ID. Formspring’s delivery log shows what a per-attempt record can look like: an attempt number, HTTP status, a short error code when the request never completed, latency, dispatch time and the next retry time.
Combined, a practical receiver-side record looks like this:
| Field | Why it earns its place |
|---|---|
| Event or delivery ID | The one key that joins everything else; it answers “did we see this before?” |
| Received timestamp (UTC) | Orders events and measures lag against the provider’s timestamp |
| Endpoint, method, event type | Lets you group failures by route and type |
| Source IP | Helps spot deliveries from unexpected addresses |
| Signature result and failure reason | Separates forged or misconfigured requests from real failures |
| Attempt number | Shows whether you are looking at a first delivery or a retry |
| HTTP status returned | What the provider saw from you |
| Processing state | Received, queued, processed, failed or duplicate |
| Latency | Slow acknowledgments cause retries and therefore duplicates |
| Payload hash | Proves what arrived without storing the content |
| Correlation or trace ID | Follows the event into your queue, workers and downstream calls |
Use a fixed list of short failure reasons (for example bad_signature, malformed_body, downstream_timeout) rather than free-text messages. A fixed set is easy to filter, count and chart.
Write the log shape once
Design the entry in one helper function and call it everywhere. Ad-hoc console.log(request) calls are how secrets and personal data leak into log stores. A central function with an explicit allowlist of fields makes the safe shape the only shape.
{ "ts": "2026-11-04T14:03:22.481Z", "event_id": "evt_8f31c2", "event_type": "deposit.confirmed", "endpoint": "/hooks/payments", "signature": "valid", "attempt": 1, "status": 202, "latency_ms": 41, "state": "queued", "payload_sha256": "9b74c9...", "trace_id": "4bf92f3577b34da6"}If the provider sends no delivery identifier, generate a UUID or ULID at your load balancer or proxy, pass it to downstream calls and echo it in error responses. Your own ID then does the job a provider ID would.
What to keep out of your logs
This is where most logging goes wrong. OWASP is explicit: do not log full request bodies, signing secrets, or the values of Authorization and signature headers, and redact them from logs and error responses. Twilio’s webhook security guidance likewise says full request bodies should stay out of application logs, with sensitive fields redacted or excluded.
A signature header value is not harmless metadata. Together with a leaked body it can help someone study your verification scheme, and many log stores are readable by far more people than your secrets manager. Treat logs as a lower-trust system than your application.
Allowlist, do not blocklist
Build each log entry from the fields you have named, instead of serializing the whole request and stripping dangerous keys afterward. A blocklist fails the first time a provider adds a new sensitive field. An allowlist fails safe: a new field simply does not appear.
For layers beyond the allowlist, GitGuardian’s guidance on keeping secrets out of logs describes a multi-layered approach: minimize the data you handle, redact, tokenize or hash what remains, wrap sensitive strings in types that refuse accidental serialization, and add tests that fail when sensitive patterns show up in captured output.
Log references, not content
When you need to point at the payload, point at it indirectly:
- A SHA-256 hash of the raw body, so you can prove two deliveries were identical or detect that the same event ID came back with different content.
- The provider’s event ID and resource IDs, such as an order, invoice or transaction identifier.
- The last four characters of an identifier where a human needs to recognize it.
If you must keep the raw signed request for replay, put it in a separate, access-controlled store such as an encrypted queue or restricted object store, with its own short retention, and retrieve it by delivery ID when someone is authorized to investigate. Keep metadata retention independent of payload retention: metadata is cheap and useful for months, while payloads are a liability the moment they are not needed.
If your endpoint URL contains a secret, redact the path before it reaches load balancer, reverse proxy or APM logs. Those layers log URLs by default.
Log signature verification as its own step
Verification deserves its own log line, separate from processing. OWASP’s guidance is to use the publisher’s maintained verification library, give it the raw request body before any framework parsing, recompute the HMAC, compare in constant time and accept only the expected signature scheme. When the signature is missing or wrong, return 401 without explaining why.
What you log here is the verdict, not the evidence: pass or fail, the scheme, and a short reason code. Never the computed or received signature. A rising count of failures is one of your best early signals, because it can mean a rotated secret, a proxy altering the body, or probing.
A valid signature proves who sent the payload, not that its contents are safe. Validate the schema and values before acting, and log validation failures separately from signature failures so the two causes do not blur together.
On our side, we added more control over this layer; our post on a new feature to enhance webhook security covers how signed deliveries work.

Verify, enqueue, acknowledge: log each stage
The most reliable receiver design is short: verify the signature, put the event on a queue, return a 2xx quickly, and do the real work asynchronously. Providers expect fast responses, and a slow handler gets retried, which creates duplicates.
That design gives you natural log points:
- Ingest: request received, size, source IP, event ID.
- Validation: signature and schema verdict, with the reason code on failure.
- Queue: event accepted, queue name, time scheduled.
- Processing: worker start, outcome, duration, error code if any.
- Retry or dead letter: next attempt time, or the reason the event was parked.
Carry the same event ID and trace ID through all five. Then one filter on the event ID returns the whole story, and you can see exactly where a delivery stopped. If you want a deeper look at this pattern, our piece on webhooks vs WebSockets and the ingest, queue, fan-out pattern walks through it.
Logging retries, duplicates and failures
Duplicates are normal
Providers that guarantee at-least-once delivery will send the same event more than once, especially after a timeout on your side. So duplicates are not an anomaly to hide. Log them as a state.
Use the provider’s immutable delivery or event ID as the idempotency key. If IDs are only unique per account, scope the key by provider and account. When an event is seen again, record duplicate, skip the work and still return 2xx so the provider stops retrying. If the same ID ever arrives with a different payload hash, do not process it: quarantine it and alert someone.
Read status codes the way providers do
How a provider treats your response determines your retry traffic. One documented scheme treats a 2xx within a few seconds as success, treats 408, 429, 5xx and timeouts as retriable with backoff, and treats other 4xx responses as permanent failures that move to a dead state without further retries (ObjectOS webhook documentation). Providers differ, so check yours, but the lesson holds: the status you return is a decision about whether the event comes back.
This is why logging the returned status and the attempt number together is so useful. A burst of 500s followed by attempt 2 and 3 entries tells you the cause is on your side and retries are already on the way.
Use log levels that match urgency
Map outcomes to levels so on-call engineers can filter: success at info, 4xx responses at warn, and 5xx, timeouts and network errors at error. Keep debug logging off in production by default, because debug output is where payloads and headers tend to appear.
Separate your retries from the provider’s
Two retry loops stack up quickly. The provider retries delivery to you; your own workers may retry a failed downstream call. Log which one an attempt belongs to, retry only transient failures such as timeouts and 429, 502, 503 and 504, use exponential backoff with jitter, and move exhausted events to a dead-letter queue where a person can review them.
Sample high-volume successes only
At very high volume, logging every successful first attempt gets expensive. A common compromise is to sample a small fraction of clean successes while keeping every retry, failure, dead-letter event and signature failure. Keep metrics counts exact even when log lines are sampled, so dashboards stay honest.
Metrics and alerts built on the logs
Logs explain one delivery; metrics show whether the system is healthy. Derive both from the same structured fields. Field Nation’s webhook monitoring guide gives a concrete starting set of targets:
| Metric | Starting target |
|---|---|
| Delivery success rate | Above 99% |
| Delivery latency | Under 5 seconds at p95 |
| Retry rate | Under 5% |
| Timeout rate | Under 1% |
| Processing duration | Under 2 seconds at p95 |
| Queue depth | Under 100 |
| Dead-letter queue size | 0 |
Treat these as a baseline to tune against your own traffic, not as universal thresholds. A payments queue and a newsletter queue deserve different numbers.
OWASP’s alerting guidance is more about patterns than figures: alert on spikes in signature failures, on sustained 4xx or 5xx responses, and on deliveries from unexpected source addresses. Add three more that cost little:
- Silence: no events received for longer than your normal gap. A quiet endpoint is often a broken subscription or a changed URL.
- Dead-letter growth: any sustained climb means events are failing for good.
- Duplicate rate: some duplication is expected, but a high rate usually means your endpoint is acknowledging too slowly.
Page a human on conditions that need action (failure rate across a window, queue growing, DLQ accumulating), and send the rest to a dashboard. Alerts on single failures train people to ignore the channel.
Using the logs to troubleshoot production
When something breaks, work from the delivery ID outward:
- Find the entry. Search by event ID. No entry means the event never reached you: check the subscription, the URL and the provider’s own delivery history.
- Check validation. A failed signature points to a secret mismatch, a body altered by a proxy, or a parsing step running before verification.
- Check the response. Which status did you return, and how long did it take? Slow responses and 5xx lead straight to retries.
- Check the state. Was it queued but never processed? Processed twice? Marked duplicate?
- Retrieve the payload only if needed. Use the ID to pull the raw request from the restricted store, and replay it through your handler’s controlled replay path, not by hand-posting it to production.
Test this before an incident. Send seeded test events containing fake secrets and sensitive-looking fields, then assert that none of them appear in captured logs. Fire duplicates, bad signatures and malformed bodies and confirm each one produces the log entry and state you expect. A redaction rule you have never tested is an assumption.
Webhook logging for blockchain events
On-chain notifications add a few wrinkles. The same transaction can be reported as it is seen and again as it confirms, so log the transaction hash and the event’s confirmation state alongside the event ID. Keep chain, address and transaction identifiers in the log, since they are public and give you precise search keys, while keeping API credentials and signing secrets out. Deposits are the classic case: if your handler credits a balance, idempotency and clear state logging are what prevent a double credit. Our guide on using webhooks to process deposits automatically shows how this fits together, and the notes on address monitoring cover how events are generated in the first place.
Our perspective
Most webhook incidents we see discussed are not exotic. A handler answers too slowly, the provider retries, a duplicate slips through, and nobody can say afterward what the system actually received. Logging is the difference between a ten-minute fix and a day of guessing.
That is why we build Chaingateway around payloads that arrive already decoded, with HMAC-signed requests, so your receiver can verify first and spend its effort on your business logic instead of parsing raw chain data. Less custom decoding means fewer places for a log line to leak something it should not, and a smaller surface to test.
Our advice is to settle your log shape once, key everything on the event ID, and treat duplicates and retries as ordinary states in your pipeline. Do that, and a unified webhook feed across several chains stays as debuggable as a single one.
Bitblade
Get decoded, signed events without running nodes
If you are building payment or wallet features, you can spend your time on the receiver and its logging instead of on chain-specific plumbing. Chaingateway Webhooks delivers real-time blockchain event notifications with HMAC-signed requests across networks including Ethereum, Bitcoin, Tron, Solana, Polygon, BNB Chain and Arbitrum, with no need to run your own nodes.

Plans start at €49 per month for Plus, with Pro at €99, Premium at €249 and Enterprise at €499 per month. Annual billing is €490, €990, €2490 and €4990 respectively. A free trial comes first. See the pricing page for what each plan includes.
Sources
- Webhook Security - OWASP Cheat Sheet Series
- Webhook best practices | Mambu Documentation Hub
- Delivery log - Formspring documentation
- Webhook security | Twilio
- Keeping Secrets Out of Logs: Strategies That Work | GitGuardian
- Webhooks: At-least-once Delivery, HMAC, Retries | ObjectOS
- Monitoring Webhooks | Field Nation DX
Recommended
Frequently asked questions
No, not in your general application logs. OWASP and Twilio both advise keeping full request bodies out of logs. Log a payload hash, the event ID and the relevant resource IDs instead. If you need the raw body for replay or audit, store it in a restricted, encrypted system with a short retention period.
Set retention separately for metadata and payloads. Metadata such as event ID, status and outcome is small and useful for reconciliation, so it can live longer. Raw payloads should be kept only as long as you need them for debugging or replay. Your compliance obligations, such as PCI DSS or SOC 2, set the floor for audit logs, so check them with your security or compliance lead.
The delivery or event ID. It lets you find every attempt, detect duplicates and join the log to your queue and worker records. If the provider does not supply one, generate your own at the edge and pass it downstream.
Record a duplicate processing state against the same event ID, skip the business logic and return a 2xx so the provider stops retrying. If the same ID arrives with a different payload hash, quarantine it and alert someone rather than processing it.
Start with failure rate over a short window, any rise in signature failures, queue depth that keeps growing, dead-letter accumulation and unexpected silence from the endpoint. Tune the thresholds against your own traffic after a few weeks of data.
Ready to build this yourself? Get your API key — 7-day trial, no card required — or see the Blockchain API for the full endpoint reference.